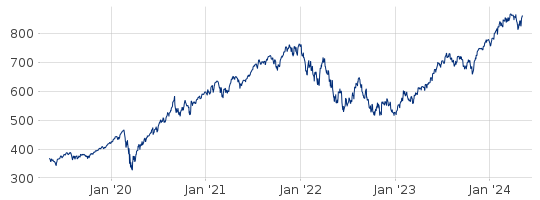
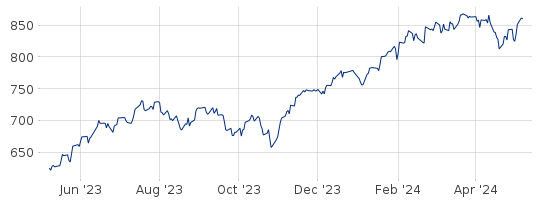
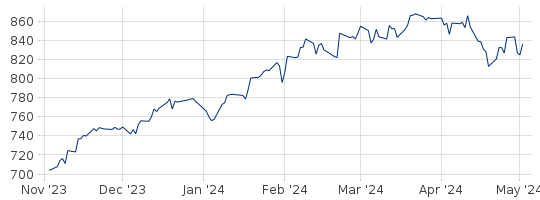
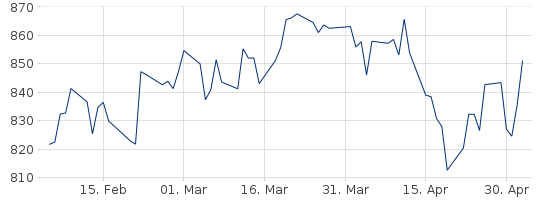
All returns shown are total returns. Past performance is no guarantee of future results. Performance information is provided by Solactive AG, the Index calculation agent (“Solactive”). Solactive is not affiliated with The Motley Fool and, while we believe this information to be reliable, we make no warranties, express or implied, regarding its accuracy for any particular purpose. This performance information does not relate to any asset management products based on this Index. No allowance has been made for trading costs or management fees which would reduce investment performance. Actual results may differ. Indices are not managed investment products, and, as such cannot be invested in directly. Returns represent simulated performance based on rules used in the creation of the Index, are not a guarantee of future performance and are not indicative of any specific investment. This material is not intended as an offer or a solicitation for the purchase and/or sale of any security or financial instrument, nor is it advice or a recommendation to enter into any transaction.
All performance presented prior to the index inception date is back-tested performance. Back-tested performance is not actual performance, but is hypothetical, and was derived from the retroactive application of the index methodology with the benefit of hindsight.
The Motley Fool (TMF) constructs, publishes, and licenses indices and does not offer or provide investment advice or offer or sell any securities, commodities or derivative instruments or products, and nothing on this website should be taken as constituting financial or investment advice. Unlike its affiliates, TMF is not registered with the SEC and is not permitted to provide investment advice. Neither TMF nor its respective directors, officers, employees or affiliates make any representation regarding the advisability of investing in any security or instrument. A decision to invest in any such security or instrument should not be made in reliance on any information on this website. Inclusion of a security in an index is not a recommendation to buy, sell or hold that security.
Motley Fool Asset Management, LLC and Motley Fool Wealth Management, LLC are affiliates of The Motley Fool (“TMF”), and all investment decisions for investment products and client portfolios are made independently by the asset managers at MFAM and MFWM. Both MFAM and MFWM are investment advisers registered with the SEC.
© 2025 The Motley Fool. All rights reserved.

